Written by Dr. Katharyn Duffy, Science Partner on the Forest Innovation Platform, and Senior Scientist at Vibrant Planet
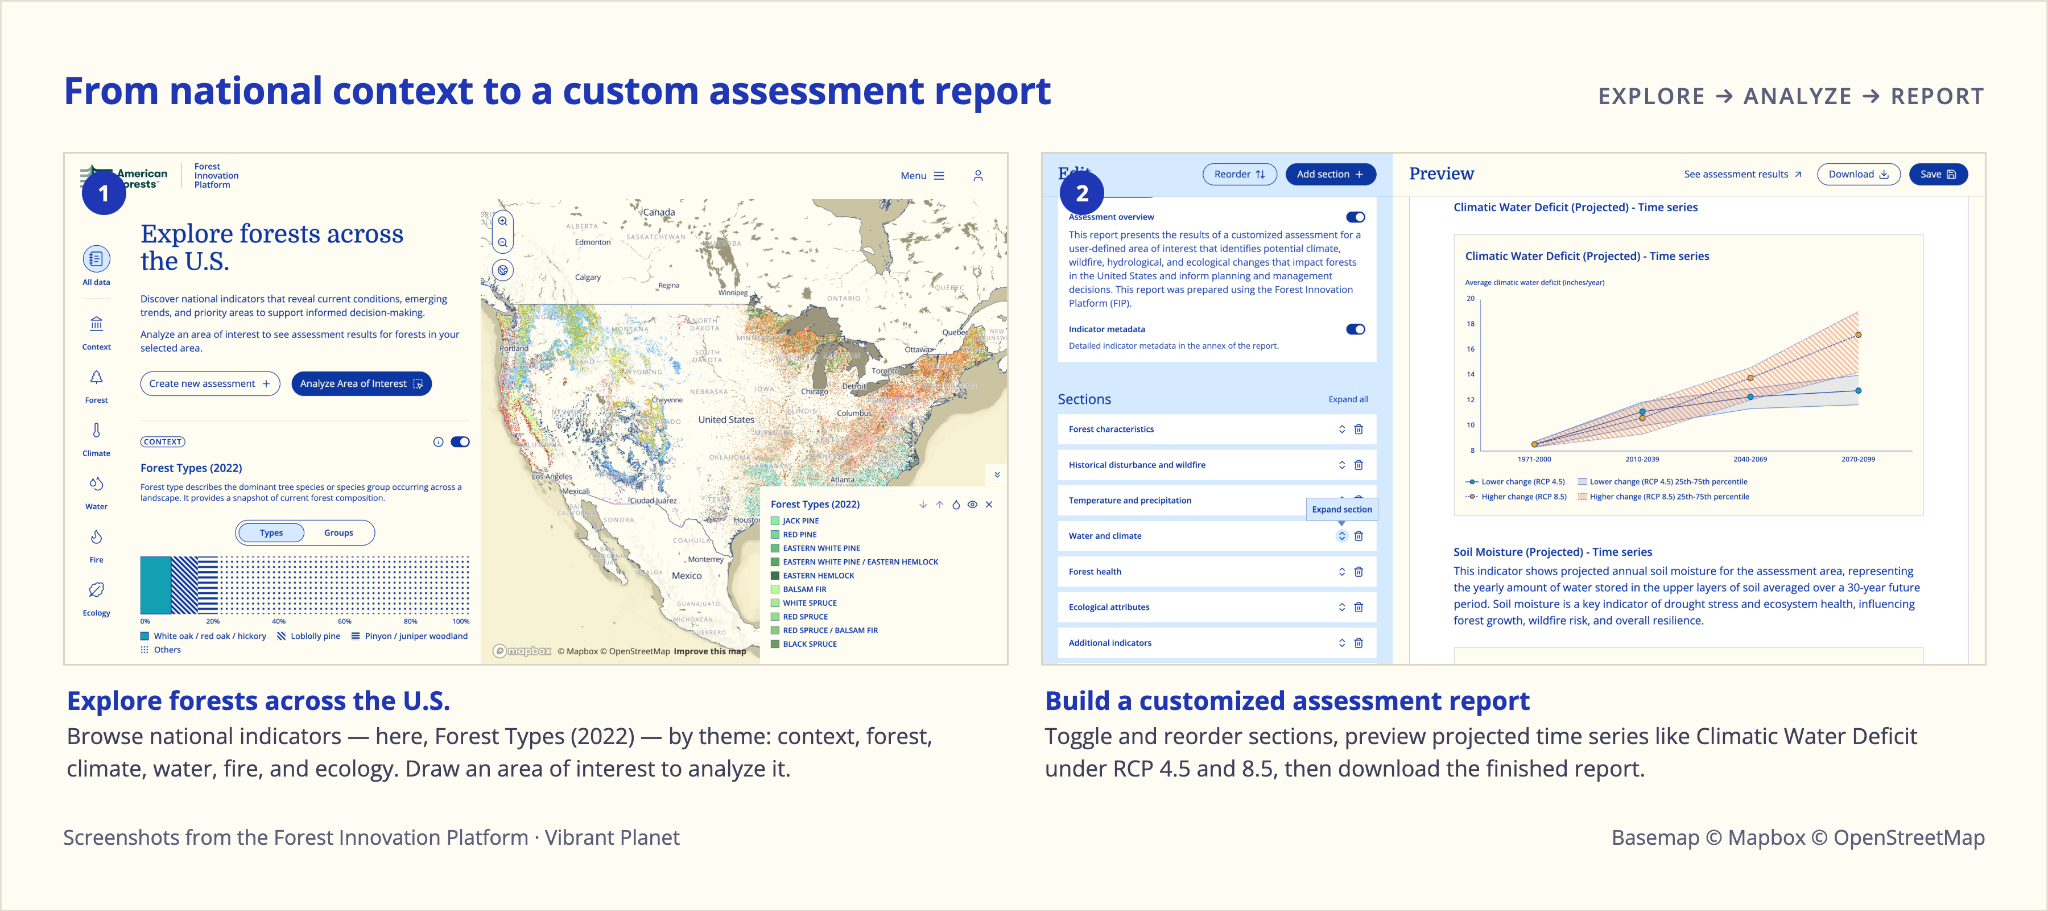
The Forest Innovation Platform (FIP) launches this week, and like any great tool it looks simple on the surface: select or draw an area, pull together thirty+ indicators of potential climate, wildfire, hydrological, and ecological changes that impact ecosystems, build an assessment, generate and curate a report. Voila! Magic!
In reality, the simplicity of the FIP interface is the result of years of hard work, a dozen archives, more than two-hundred contributors, and a run of hard choices. Forests are changing faster than any single organization can describe them, and the moment called for a unified platform to measure and make sense of these changes. But what makes this platform unique, and the story I want to tell here, is of an effort fueled by deep and powerful community research and collaboration.
What is the Forest Innovation Platform and who might use it?
The Forest Innovation Platform (FIP) is a free public platform, built by American Forests, that turns a boundary into a vulnerability assessment. Draw or select any area in the lower 48 and it returns roughly thirty indicators of how that place is changing: climate, fire, water, species, carbon, and who manages the land. The platform is designed for organizations across the industry: a biodiversity NGO asking where imperiled species meet the fastest-changing climate. A water utility watching the watershed above its intakes. A county or tribe planning across ownerships. A land trust asking whether the ecosystems on a parcel will still be there in 2050.
American Forests set out to build a public platform that assesses forest vulnerability, with early funding from the USFS and a grant from the Doris Duke Foundation. They brought together data providers, fire modelers, forest ecologists, hydrologists, land managers, you name it. Everyone arrived with something important: a use case, a cutting-edge data product, decades of experience. The platform draws on more than a dozen data sources from the Forest Service's inventory program, LANDFIRE, PRISM, CarbonPlan, NatureServe, Pyrologix, and Vibrant Planet. Those datasets range from 30 meters to 4 kilometers in resolution, and reach back to 1961 and forward to 2099. The strength is in the catalog, not the individual dataset. But a rich catalog alone was not the answer.
The gap was never just the data
Nearly everything a vulnerability assessment needs already sits in a public archive somewhere. The hardest parts of that final mile to implementation have been access and consistency: getting to the data at all, then reconciling what the metadata and units mean, how far the data reach, and which years they cover. Then there are the gaps inside the data themselves. A stand that looks fully stocked under one region's rules reads as overstocked under another's. A fire record that looks complete in Montana has holes in Georgia. Somebody had to decide what fits into a functional CONUS-wide multi-tool, then defend that to everyone whose data or use case didn't make the cut. American Forests convened working groups of experts to navigate these decisions, and did so with grace and agility.
Designed with the user in mind
The working groups led by American Forests pressed us scientists to think about how we might build a platform that cut to the core of the challenge for our end user: as a planner, where should I intervene, where should I restore, and what should I leave alone — and worked backward. That exercise produced a list of gaps that shaped the tool: the group intentionally designed the FIP to focus on one area of interest, with indicators grouped to match how people think about the different modes or themes that generate place-based vulnerability. By the end, a manager drawing a boundary around their area of interest gets to cut to the chase (and the hard trade-offs) in one fell swoop.
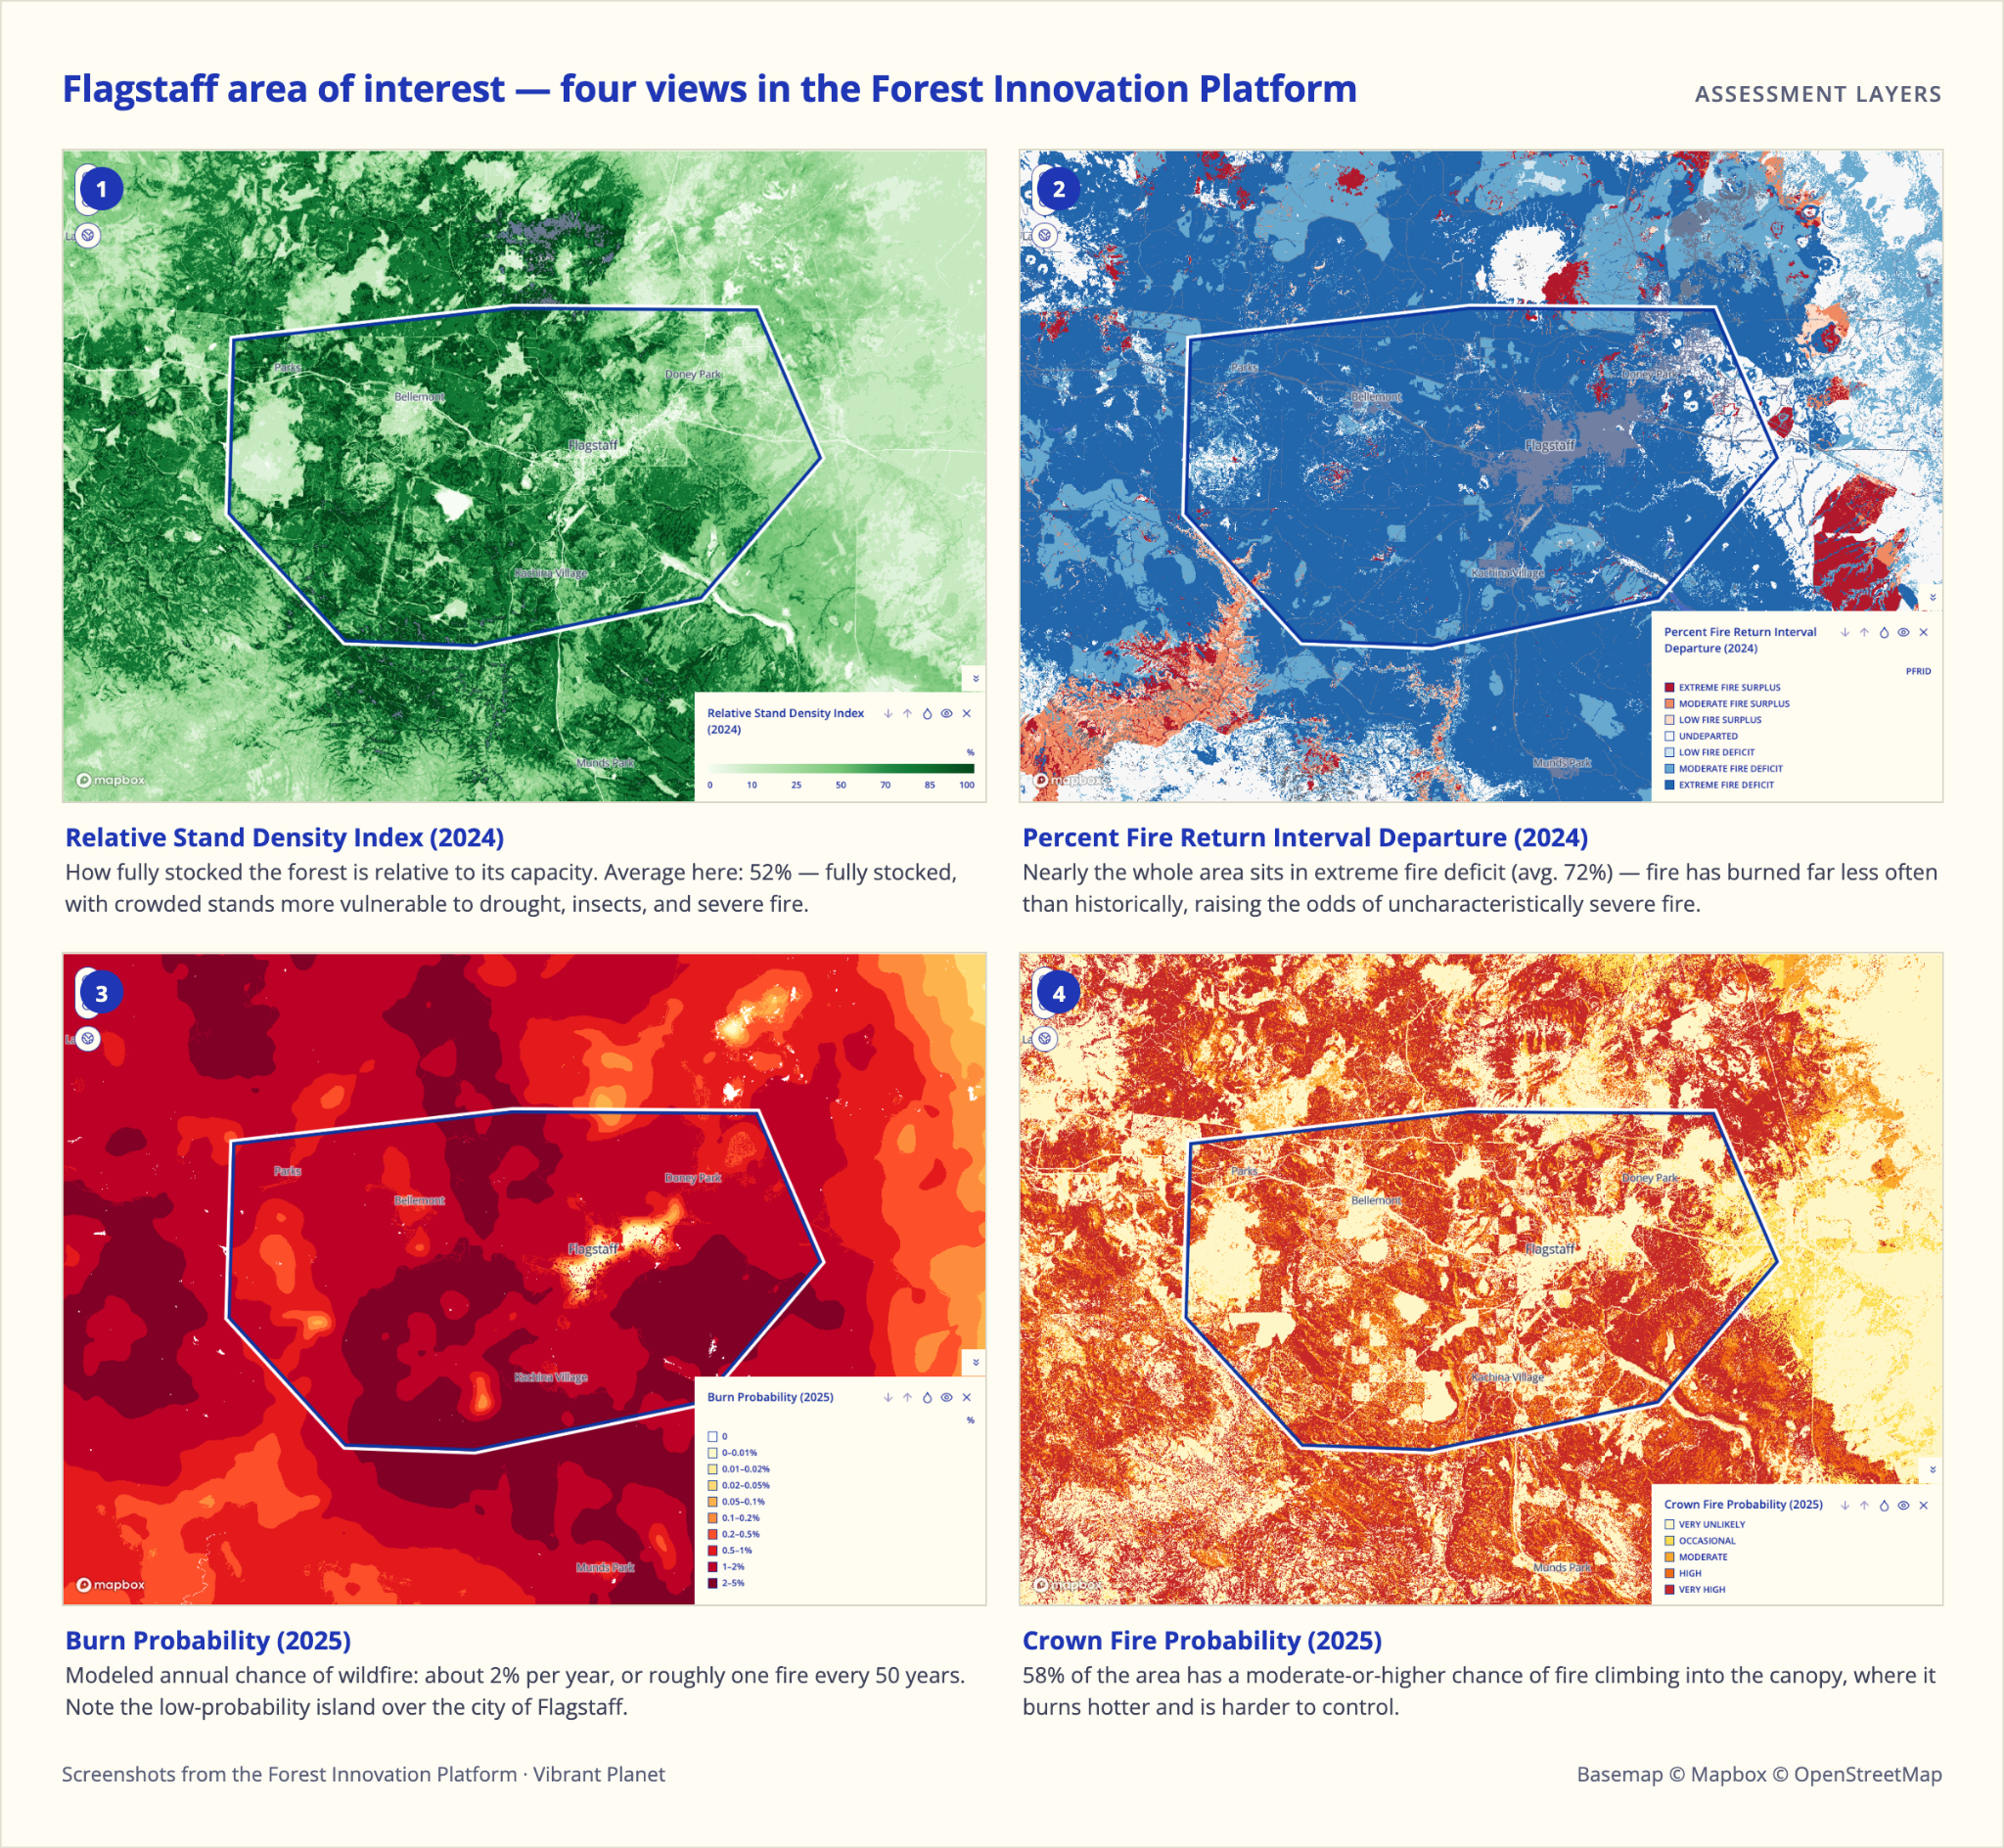
For example, a user can simultaneously explore:
- relative stand density, to see where forests are over- or under-stocked
- burn probability, to see how likely fire is to occur
- crown fire probability, to see how likely fire is to climb into the canopy
- merchantable volume, to see where treatment economics could help fund restoration
Before FIP, getting those layers side by side was a project of its own. Now, all the key data live in a single place, as shown in the example image below. Even better, you can download the raw data directly, or tabular summaries.
Harder than it looks
Take one question: how do we assess whether a forest will persist? Picture a mature ponderosa pine stand on the Mogollon Rim. Its vulnerability depends on what moves to it, through it, and past it. Fire arrives from the surrounding patchwork of forests, grass, and shrubland that conduct fires in the Southwest. Snowmelt and monsoon rain arrive from the peaks above and leave downstream. Drying arrives from the air: climatic water deficit (CWD, the gap between what the atmosphere demands and what the soil+vegetation can supply) is projected to widen across the Southwest under both of the platform's emissions scenarios. So the fire-regime layers shouldn't stop at the forest edge, and neither should CWD or precipitation. A stand that once burned every decade or so and has spent the last century filling in instead tells half its story; the patchwork of ecosystems around it tells another. Set the water deficit beside the fire deficit: crowded, unburned, and drying. The FIP gives planners a clear and comprehensive story of what’s at risk and what should be prioritized.
What Vibrant Planet brought to the FIP
Vibrant Planet and our collaborators contributed seven layers to the FIP:
- We provided three datasets that describe forest structure — basal area, relative stand density, merchantable timber volume — from a lidar and vision-based modeling system at 30 meters, built to support annual refreshes.
- Our fire science team Pyrologix contributed two fire behavior datasets: burn probability and crown fire probability.
- We built a fire return interval departure assessment, now covering the lower 48, in partnership with University of California Davis, Tall Timbers, and the University of Missouri and with support from the United States Geological Survey.
- Finally, a West-wide climate analogs layer, built with partners at the University of Montana, USFS, Conservation Science Partners, and Vibrant Planet, supported by NWCASC.
To support and improve access to these resources, Vibrant Planet Data Commons, our open science arm, recently published the forest structure data, which can be accessed here.
.jpg)
The Future of FIP
We are proud and honored to have contributed to this monumental effort, and we will keep supporting it. There's plenty left to do: more disturbance types to incorporate because wind and drought alter a forest differently than fire does. Datasets to keep current because a 2024 forest is not a 2027 forest. New use cases to accommodate as people find them, because the best tools adapt to the people using them. We're here for that journey, and looking forward to what we learn along the way, together.
The platform is live at forestinnovationplatform.org, built by American Forests with Vizzuality and funded by the Doris Duke Foundation. Our forest structure data layers are available in the FIP data hub and hosted on the Vibrant Planet Data Commons, available for academic reuse.


.png)